Healthcare organizations will be forced to navigate several headwinds in 2026.
Systems are facing a shifting landscape marked by deep reductions in federal spending, profound changes in healthcare coverage and workforce, new technologies and regulations, and volatility in capital markets. In this environment fraught with uncertainties, we have observed that hospital systems are seeking ways to adapt to their new normal, while still fulfilling their core mission of providing top-notch care for patients. In order to find firm footing, we believe healthcare organizations can reassess their portfolios to proactively put safeguards in place. With this, systems can help protect against potential shortfalls in liquidity and disruptions caused by the sweeping overhaul of U.S. fiscal and healthcare policies and market volatility.
Enter: Enterprise risk management (ERM), an approach that offers an exhaustive framework for modeling a range of economic scenarios and operational shocks to help inform investment decisions in an increasingly complex environment. ERM can serve as a strategic compass for hospital organizations, helping to optimize investment portfolios as systems adapt to the evolving healthcare landscape.
We believe establishing a comprehensive ERM framework puts hospital systems on solid ground, helping them weather financial, operational, and strategic challenges, while allowing them to do what they do best: providing care to their patients.
A Shifting Landscape
Healthcare is no stranger to change. From a revolving door of regulatory shifts to the COVID-19 pandemic, U.S. hospital systems have repeatedly transitioned from reactive responses to proactive strategies.1
In 2025, the One Big Beautiful Bill (OBBB)2 —representing a sweeping overhaul of U.S. fiscal and healthcare policy—ushered in a new wave of volatility, necessitating another wave of strategic recalibration. The legislation permanently extended many of the 2017 tax cuts, introduced new deductions, and enacted deep reductions in federal spending, including a $900 billion cut to Medicaid over the next decade. The bill is reshaping the healthcare landscape in profound ways, from changes in coverage and workforce dynamics, to shifts in technology and regulatory frameworks. Hospital systems are expected to begin to feel the impacts of these changes in the coming months and years, as provisions affecting Medicaid, Affordable Care Act (“ACA”) coverage, and provider reimbursement are phased in beginning in federal fiscal year 2026, with more substantial financial pressure expected by 2027 and beyond.3 In response, we are encouraging hospital systems to proactively address the anticipated changes by identifying, reviewing, and mitigating new risks to ensure operational longevity and preserve value.
In our view, this encompasses the following:
- Hospital systems should consider reassessing their operating portfolios specifically to account for the elevated risks that stem from the anticipated decline in Medicaid reimbursements, growing complexity of commercial managed care contracts and evolving payer mixes that are a result of the OBBB.
- Liquidity planning, already something we believe to be a key consideration, is critical. Systems should evaluate short- and long-term liquidity needs, and conduct stress tests to determine whether existing cash reserves are sufficient to absorb reimbursement shortfalls or to fund strategic initiatives in an increasingly uncertain environment.
- Systems also should reexamine asset allocation within their operating portfolios to ensure alignment with the current risk environment. This goes beyond simply confirming cash balances and extends into asset allocation and underlying investments. For instance, within public equity composites, systems should assess risk exposure and potential factor tilts that may amplify volatility. Within fixed income, we believe it is important to strike a balance between safe-haven fixed income earmarked for near-term liquidity and return-seeking investments that enhance yields and diversification.
- Systems should closely examine allocations to private markets investments within their operating portfolios, and determine if existing capital commitment budgets to illiquid and semi-liquid investments remain appropriate and in line with the overall system’s risk tolerance.
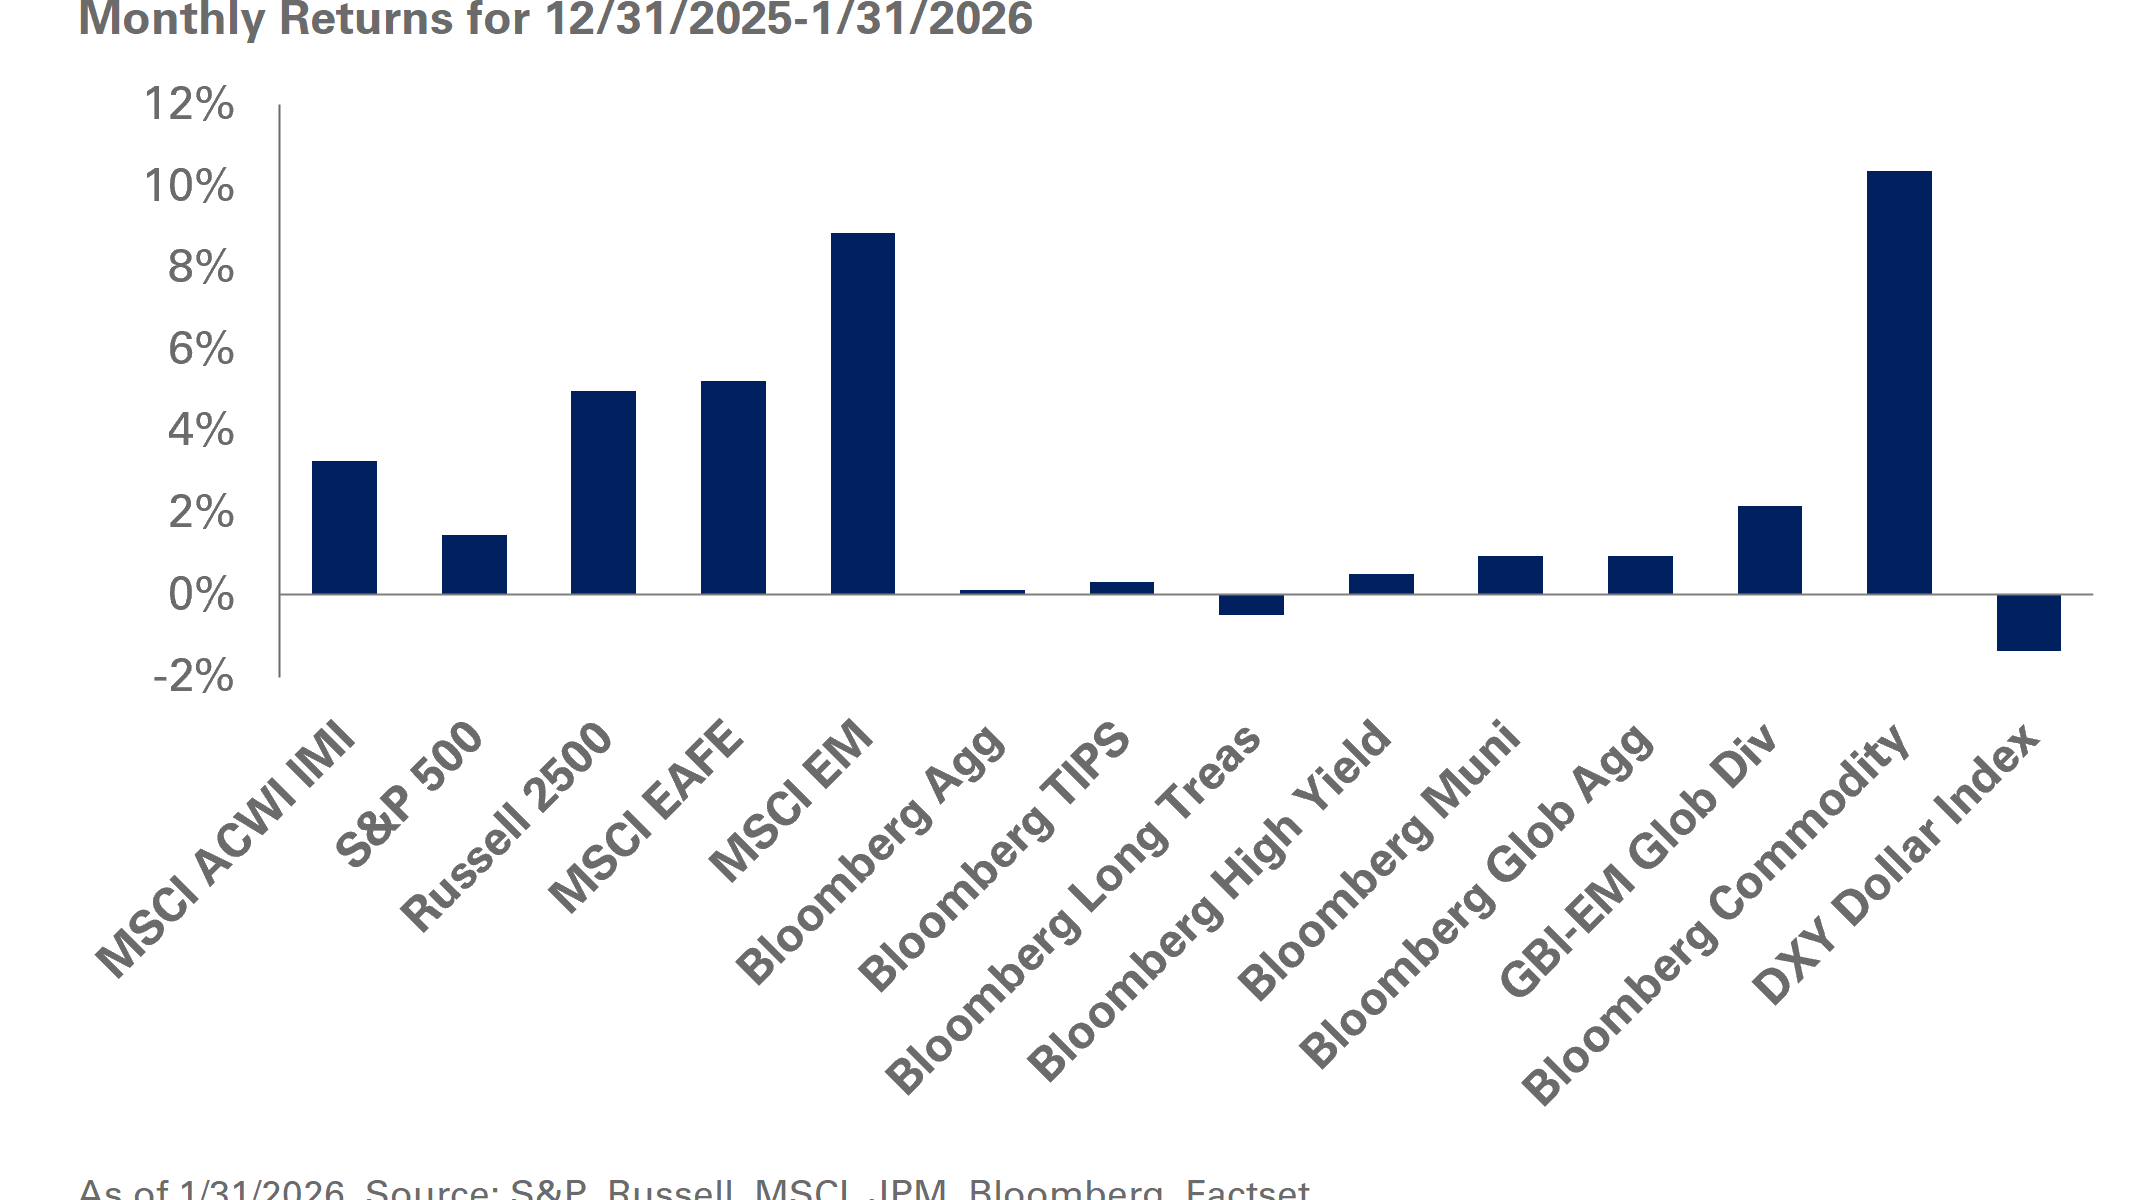
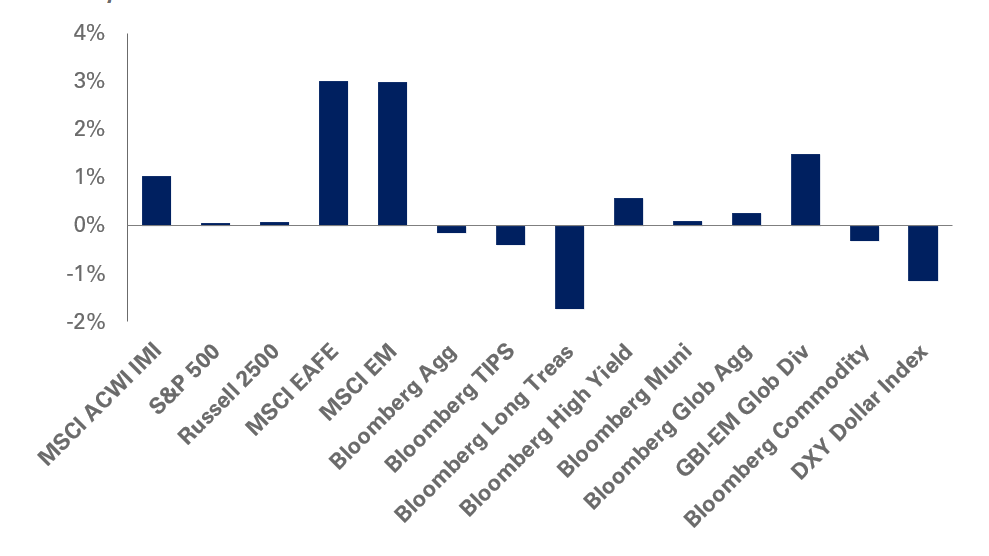
While much of the focus has centered on regulatory changes, we believe it is also imperative to consider capital markets and the macroeconomic environment. In the past decade, strong market performance has helped cushion operational headwinds and regulatory uncertainty (with the exception of 2022).4 This sustained market strength, in many cases, has masked underlying vulnerabilities in operating margins, payer mix, and liquidity.
1Balser et al., Care Systems COVID-19 Impact Assessment: Lessons Learned and Compelling Needs (2021), National
Academy of Medicine
2H.R. 1 – 119th Congress (2025-2026): One Big Beautiful Bill Act, H.R. 1, 119th Cong. (2025).
3OBBBA Poses Long‑Term Challenges for U.S. Not‑for‑Profit Hospitals” — Fitch Ratings, July 10, 2025
4Source: S&P 500 Total Return Data (S&P Global / SlickCharts) (12/31/2025).
A State of Dispersion
The challenges may not be felt by all healthcare systems equally.
Although numerous factors will influence how each hospital system experiences the impact of the OBBB, two stand out to us as the most significant: payer mix and state-level legislation. As an estimated 11 million individuals are projected to lose Medicaid coverage, hospitals are preparing to see an increase in self pay patients, leading to rising bad debt and charity care, particularly in emergency departments. As a result, it can be surmised that states with a higher reliance on Medicaid face greater pressure on margins, while commercially weighted markets may be more resilient. Responses of each state will further influence financial performance.
Payer mix, the proportion of hospital revenue derived from Medicare, Medicaid, commercial insurance, and self-pay is a key driver of financial performance. Hospitals with higher shares of commercial payers typically achieve stronger margins, often in the high single-digit range5, as commercial reimbursement subsidizes losses from public payers. In contrast, systems heavily reliant on government programs, such as Medicare and Medicaid, operate with thinner or even negative margins that generally range between 0% and 2%, but can fall as low as -20%+ for safety-net and rural hospitals.5 This dynamic has evolved over time and is expected to shift even further under the OBBB, amplifying financial pressure on systems with greater exposure to public payers.
We have analyzed three sample states, California, Texas, and Florida, to illustrate how geography and payer mix intersect. While hospital systems within each state vary by size, payer mix and financial performance, the aggregate data reveals notable dispersion by state. In this sample (Figure 1), it is clear that Texas and California are significantly more reliant on Medicaid relative to systems in Florida, which have a much higher median share of commercial and managed care patients.
As shown in Figure 1, these differences suggest that the financial impact of OBBB will be far from uniform. States with greater Medicaid exposure face heightened reimbursement risk and margin pressure, while those with stronger commercial payer bases may be more insulated from volatility.
5Fitch Ratings, “OBBBA Poses Long‑Term Challenges for U.S. Not‑for‑Profit Hospitals” (July 10, 2025).

based on fiscal year end and the information publicly available.
Data sourced from audited financial statements for healthcare systems covering 21 in Florida, 13 in Texas, and 21 in California—reveal that payer mix varies significantly across states, serving as a key determinant of financial performance. Florida’s hospitals, with a lower median Medicaid share and greater commercial exposure, are better positioned to sustain current margins under OBBB, while Texas and California’s higher reliance on Medicaid reimbursement leaves them more vulnerable to cuts and margin compression. These disparities highlight why state-level payer mix is a critical input for risk modeling and investment strategy decisions. California, Texas, and Florida are the three most populous U.S. states and collectively represent a substantial share of national healthcare utilization. They also span a wide range of payer mix and demographic profiles, making them a useful cross-section for assessing hospital financial exposure and payer-mix sensitivity.
Policy and legislative differences further compound this state-by-state variability. Certain government programs (e.g. Medicaid) are administered at the state level, creating significant differences in eligibility, reimbursement rates and strategy.6 As a result, we take the stance that hospital systems should closely monitor state-specific policy developments and state-level negotiations. Some states may adjust eligibility criteria to mitigate unintended coverage losses, while others could pursue waivers to delay or soften the impact of Medicaid cuts.
In light of these disparities, we believe hospital systems should evaluate not only the liquidity profile of their investments, but also assess the inherent risk in their portfolios going forward. Enterprise risk management can play a pivotal role in this process by helping organizations model the financial impact of different economic scenarios, quantify exposure to reimbursement volatility, and align investment decisions with operational realities.
6Centers for Medicare & Medicaid Services. (n.d.). Medicare & Medicaid basics (MLN909330). U.S. Department of Health & Human
Services. https://www.cms.gov/fi les/document/medicare-and-medicaid-basics.pdf.
Enterprise Risk Management
We believe ERM offers a comprehensive framework for modeling a range of economic scenarios and operational shocks to help inform investment decisions in an increasingly volatile and uncertain environment.
SKYAN™*, NEPC’s proprietary ERM platform, allows hospital systems the ability to model different scenarios tailored to their unique financial outlook and areas of potential impact, such as increased capital expenditures, wage adjustments, shifts in payer mix, and margin dynamics – all of which are customized to their organizations. SKYAN enables users to simulate economic shocks, such as margin compression or macroeconomic shifts, to ensure investment strategies remain aligned with evolving operational realities. This dynamic approach offers a clearer understanding of a system’s risk tolerance in the context of financial projections, organizational resilience, and broader industry trends.

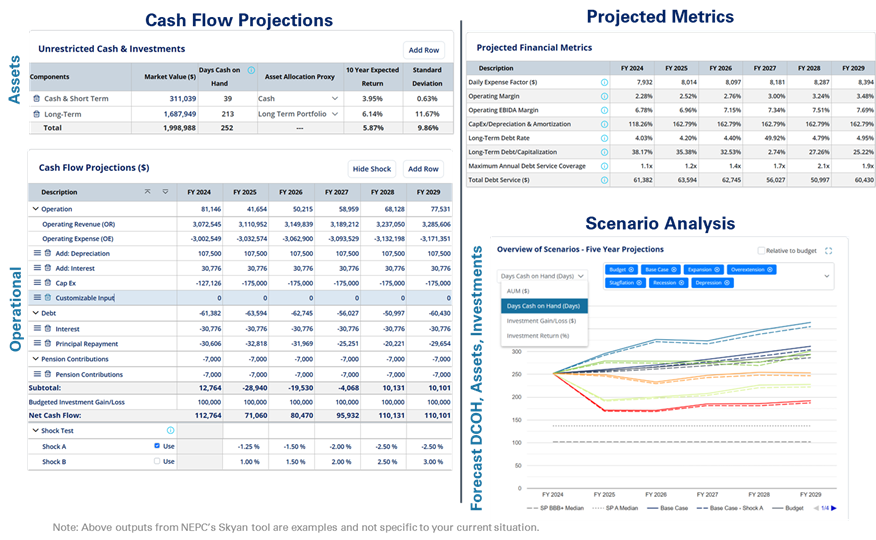
This figure illustrates SKYAN’s core capabilities, combining cash flow projections with scenario-based forecasting. On the left, the dashboard displays detailed projections of unrestricted cash and investments, including asset allocation and expected risk-return metrics, alongside cash flow projections specific to a given system. On the right, scenario analysis charts compare five-year projections for total assets, days cash on hand (DCOH), and investment returns across various economic scenarios to provide a clear view of potential outcomes relative to budget assumptions. Please see additional disclosures at the end of these materials.
With a range of modeled outcomes tailored to each organization, we believe hospital systems can make better informed, data-driven decisions around portfolio construction. For example, a chief financial officer, staff or investment committee can evaluate critical questions, such as whether the illiquidity tied to private market commitments remains sustainable, or if higher-volatility strategies are still aligned with the system’s investment objectives and overall risk profile.
At the intersection of regulatory disruption and uncertainty around capital markets, we hold the view that the need for proactive planning has never been greater. In our experience, we’ve found that insights derived from ERM often lead to investment strategies that more accurately reflect a system’s true risk tolerance and long-term objectives. By leveraging tools like SKYAN, we believe hospital systems can simulate a range of outcomes across both operations and investments, enabling leadership to make decisions that reflect their true risk tolerance and financial priorities. Ultimately, our goal remains unchanged. We continue to seek to construct resilient portfolios that balance liquidity and risk; thereby bolstering the healthcare system’s long-term objectives and organizational value.
Conclusion
As we enter this new era of healthcare, we are of the opinion that proactivity is essential. Consequently, we recommend that hospital systems routinely reassess asset allocation across investment portfolios, and frequently review liquidity profiles and payer mix exposures. The frequency of these reviews may need to accelerate in order to match the speed of change within the healthcare landscape. While we have observed that the current environment poses immediate challenges, it also catalyzes innovation and strategic transformation—offering investment leaders the potential opportunity to redefine how capital supports mission-driven healthcare.
To learn more about how ERM and SKYAN could be an effective approach for your organization or to discuss further, please reach out to your NEPC consultant or inquire here.
*SKYAN, NEPC’s proprietary ERM platform, is a financial modeling tool provided for educational, informational, and illustrative purposes only. The results, projections, and simulations generated by SKYAN do not constitute financial, investment, tax, or legal advice. Using SKYAN does not create a fiduciary relationship between you and NEPC. SKYAN is an interactive modeling tool intended to inform strategic investment decisions and integrate financial data and projections with investments. SKYAN leverages financial data based on audited financials or custom data from clients, which can include assets, debt and principal payments, pension-related expenses (if relevant), and investment detail when available. Based on these inputs and NEPC’s Capital Market Assumptions, the tool models various investment outcomes over different time periods and market environments. The models generated using SKYAN are not a guarantee of any specific returns or outcomes, but rather, are designed to show a statistical simulation using mathematical models of the likelihood of different investment outcomes and impact of financial data and projections on investments. Results will vary, potentially with each use and over time, because of different market conditions and changes in investment variables. The use of the SKYAN platform alone cannot determine the investments you should make. All investing carries the risk of loss. The projections or other information generated by SKYAN regarding the likelihood of various investment outcomes are hypothetical in nature, do not reflect actual investment results, and are not guarantees of future results. Projected performance cannot accurately predict future market conditions or resulting performance. Hypothetical past performance illustrations are created with the benefit of hindsight and can be manipulated by choosing investments with better performance.